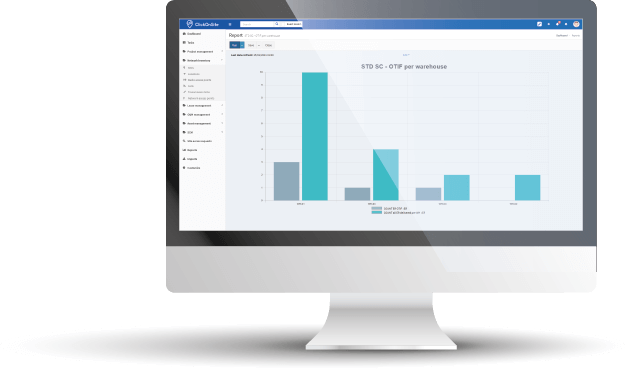
Reporting
The system lets you generate reports for any specified date range, and can report on a single project, all projects, or any specific network aspect. Reports are presented visually using graphs, stats, tables, etc.
Key benefits
- Increased project status reliability
- Real-time progress tracking
- Improved access to information
- Enhanced communication
- Fully configurable

Challenges
Unfortunately, organizations often struggle to identify data strategic assets,
and information is often duplicated and maintained in multiple systems.
As a result, organizations repeatedly miss opportunities and make costly errors.
ClickOnSite Reporting involves identifying values in the database that could be directly applied to both day-to-day
business and future planning: sharing a common set of measures that include forecasting and performance measurement.
Information sharing
Projects do not fail from a lack of charts, graphs, stats, or reports, they fail from a lack of clear communication. ClickOnSite solves this problem by providing reporting features tailored to improve the communication between people working together on your network. Therefore, reporting information will be found wherever it is proven the most efficient communication-wise: Dashboard in a dedicated reporting module, to-do list on each user home page, etc.
Real-time project visibility
Without ClickOnSite Reporting, you can spend a considerable amount of time preparing project status reports. ClickOnSite Reporting helps ensure current project status and deliverables are available in real-time without extra effort.
The dashboard includes Gantt charts to visually measure project progress and schedules.
Notifications
Visual indicators are displayed to point out the importance or the risks of a project, using color codes. The missing dates, the out-of-scope activities, and any other anomalies requiring attention are listed, with the details just a click away.
Reports delivery
All reports can be scheduled for automatic distribution to multiple recipients including to a corporate head office.
They can be saved with various options for reuse and can be exported to HTML, Microsoft word, or excel.
Functionality summary
Reporting
- Automatic compilation into a weekly dashboard
- To-do-list
- Personalized information
- Quick access to information
- Alerts

